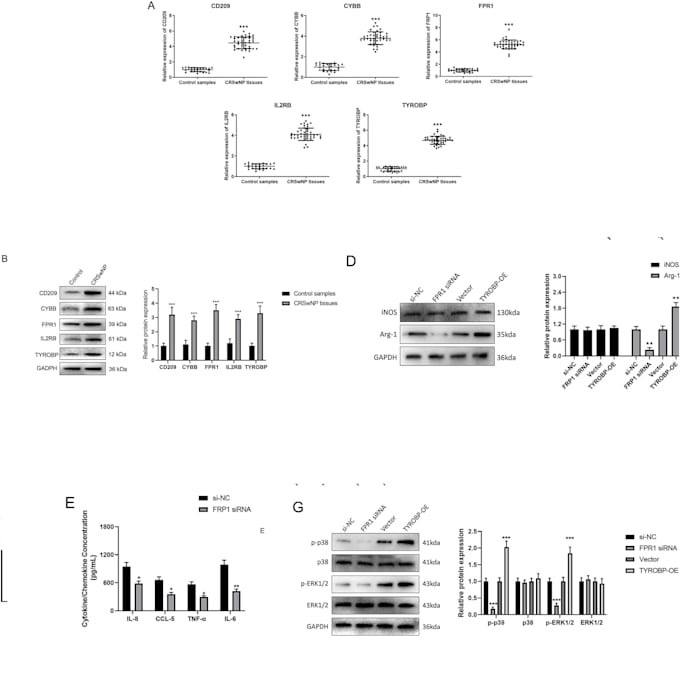
I provide scientific chart creation, figure polishing, and visual formatting services using Origin, GraphPad Prism, R, and Python. I help clients turn their provided data into clear, professional, and visually consistent charts for reports, presentations, and publication-ready materials.
I can create and refine bar charts, line charts, scatter plots, box plots, violin plots, heatmaps, multi-axis charts, combined figures, 3D charts, and multi-panel layouts. I also help improve fonts, colors, legends, axes, spacing, resolution, and overall visual consistency.... Mehr lesen