Ich werde ein interaktives Diagramm mit d3 js erstellen

W
wiktorian
W
wiktorian
Wiktorian

Level 2

Einige Informationen wurden automatisch übersetzt.

Über diesen Service

Automatische Übersetzung

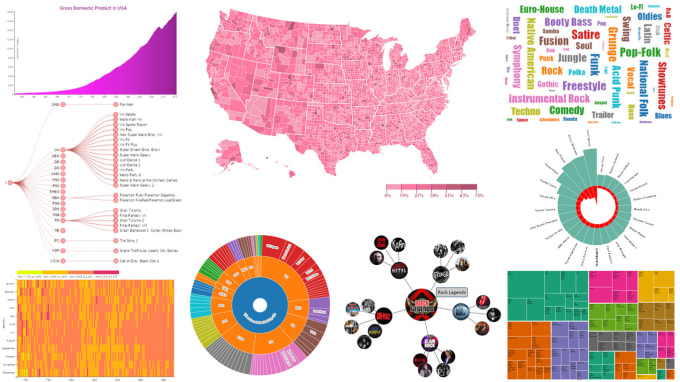
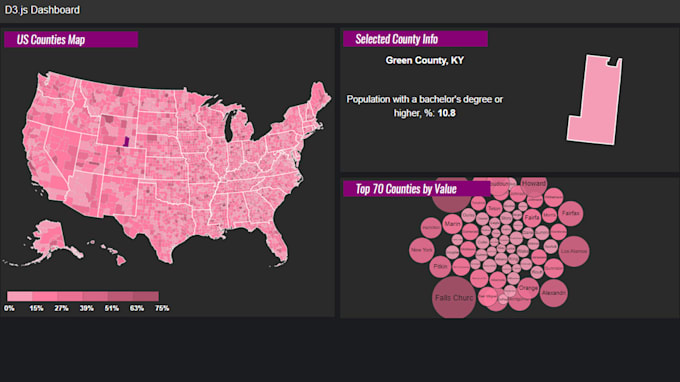
Ich biete Ihnen meine Dienste zur Entwicklung statischer und interaktiver Datenvisualisierungen mit D3.js gemäß Ihren Anforderungen an.


Bitte besprechen Sie Ihre Bedürfnisse und Anforderungen mit mir, bevor Sie eine Bestellung aufgeben. Danke :)

Lerne Wiktorian kennen

Wiktorian

I develop interactive maps for various needs

5,0(248)

Level 2

  • AusUkraine
  • Mitglied seitDez. 2016
  • ⌀ Antwortzeit1 Stunde
  • Letzte Lieferung1 Woche
  • Sprachen

    Ukrainisch, Englisch
Cartographer and Map Developer I focused on web mapping, GIS solutions, and graphic design (for maps). I am specialized in the work with interactive maps in vanilla JavaScript, SVG, HTML5 and also with GIS visualizations, geospatial analysis, processing, and vectorization ortho & raster images. I have the experience to work with geographic information systems as ArcGIS, QGIS, Google Earth, OSM and JavaScript libraries as D3.js, MapBox, Leaflet js, Google Maps JavaScript API, Carto and other.

Automatische Übersetzung

Mein Portfolio

Meine weiteren Dienstleistungen im Bereich Datenvisualisierung