Kategorien durchsuchen
Entdecken
Fiverr Pro
Deutsch
$
USD

Struggling to turn your complex datasets into clear, impactful stories?
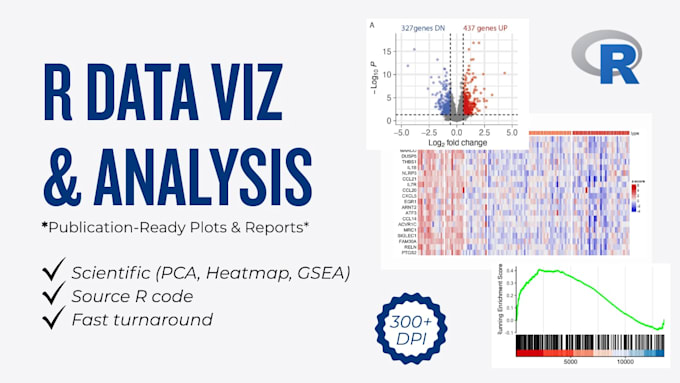
Whether you are a researcher preparing for a high-impact publication or a business owner needing to make sense of your data, I am here to help. I specialize in transforming "messy" data into stunning, high-resolution visualizations using R and ggplot2.
What I offer:
How it works:
Bioinformatician
Sprachen
What format should my data be in?
I work best with CSV, Excel (XLSX), or TSV files. If you have raw sequencing data (FASTQ) or specific bioinformatic formats (VCF, BAM, etc.), please message me first so we can discuss the preprocessing steps required.
Can you create plots for scientific publications?
Absolutely! I provide high-resolution figures (300 to 600 DPI) in formats like PDF, TIFF, or PNG. I can also follow specific journal guidelines for font sizes, color palettes (CMYK), and dimensions.
Do I get the R code used for the analysis?
Yes! In the Standard and Premium packages, I provide the full .R or .Rmd (R Markdown) script. This ensures your work is reproducible and you can see exactly how the data was handled.
My data is messy and needs cleaning. Is that included?
Basic data cleaning is included in the Standard and Premium packages. If your data requires extensive "wrangling" or complex merging of multiple datasets, please contact me for a custom quote!
Can you handle non-biological data?
Yes! While my background is in Bioinformatics, I am highly experienced in general data analysis and visualization. If you have business, environmental, or social science data, I can certainly help you visualize it effectively in R.
