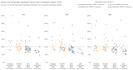
Ich erstelle einfache und fortgeschrittene Diagramme in Python, matplotlib und seaborn

T
tanya_lomskaya
T
tanya_lomskaya
Tanya L
Einige Informationen wurden automatisch übersetzt.

Über diesen Service

Automatische Übersetzung

Ich entwickle sowohl einfache als auch fortgeschrittene Matplotlib- und Seaborn-Grafiken, die auf Wunsch im PDF-Format zum Drucken bereitstehen.


Deine Eingabe:

Daten in beliebigem Format (.csv, .xlsx, .json, sql usw.)


Mein Ergebnis:

Statische Grafiken im .png-, .jpg- oder .pdf-Format;

Jupyter Notebook mit allen Diagrammen und Codes.


Diagrammtypen — beliebig (Streudiagramm, Histogramm, Boxplot, Heatmap, Balkendiagramm, Kreisdiagramm, Gantt-Diagramm, Violinen-Diagramm, Word Cloud usw.). Weitere mögliche Typen findest du hier: https://matplotlib.org/3.1.1/gallery/index.html


Lerne Tanya L kennen

Tanya L

Data Analyst with expertise in Tableau and Python

  • AusGeorgien
  • Mitglied seitJuni 2026
  • Sprachen

    Russisch, Englisch
I am a data analyst with a passion for transforming complex data into structured and actionable visual stories. I help with: ⬩ Dashboard design (Tableau, Power BI); ⬩ UX-focused dashboard (re)design; ⬩ Dashboard conversion: Tableau to Power BI and back; ⬩ Exploratory and statistical data analysis (Python, SQL); ⬩ Data extraction, cleaning, and transformation; ⬩ Python visualization (Matplotlib, Seaborn, Plotly). I love working on new projects and finding effective solutions to complex business problems. If this resonates with you, please contact me—I'm always happy to discuss collaboration.

Automatische Übersetzung