Kategorien durchsuchen
Entdecken
Fiverr Pro
Deutsch
$
USD

Power Bi Developer
Kompetenzen
Meine Dienstleistungen
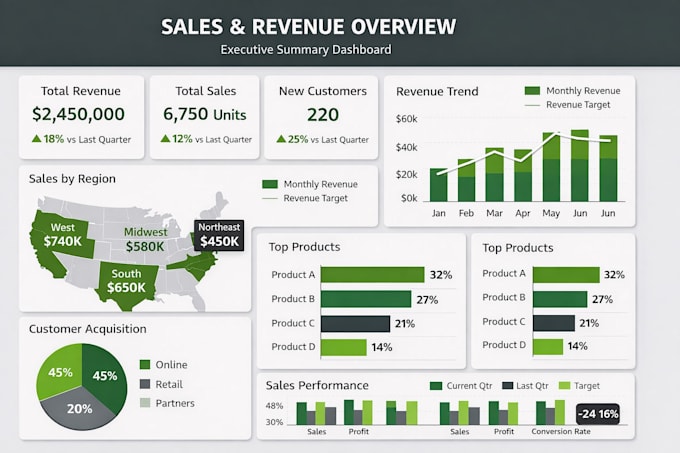
Power Bi Developer/Trainer
Self • Freiberufler
Sep 2025 - Dec 2025 • 3 mos
As a freelance Power BI developer and trainer delivered interactive dashboards, data models, and automated reporting solutions for business teams. I help turn complex data into clear, actionable insights using Power BI, DAX, and Power Query. Alongside, I provide practical Power BI training, focusing getting started with Power Bi turn data into insightful enterprise level visuals, best practices, and performance optimization.

Tech Mahindra
Vollzeit • 3 yrs 3 mos
Software Engineer
Jun 2022 - Sep 2024 • 2 yrs 3 mos
Designed, developed, and automated end-to-end ETL/ELT data pipelines using Python, AWS, Snowflake, and Azure Data Factory to streamline data ingestion, transformation, and reporting processes, resulting in a 30% improvement in report generation time and saving over 100 analyst hours per month, while also implementing robust automation frameworks that significantly improved data refresh efficiency and reduced manual intervention across reporting workflows; built and delivered more than 20 interactive Power BI dashboards for sales, risk, and operations teams, enabling data-driven insights for over 150 stakeholders by translating complex, multi-source datasets into intuitive, business-friendly visualizations; developed Python-based data validation and quality-check scripts for datasets sourced from AWS S3 and Snowflake to ensure accuracy, consistency, and reliability, leading to a noticeable reduction in data discrepancies and improved trust in reporting outputs; created executive-level dashboards to support quarterly business reviews and strategic decision-making across more than three business units by highlighting key performance indicators, trends, and operational insights; coordinated closely with finance, compliance, and IT teams to align data definitions, resolve inconsistencies, and streamline collaboration across partner and internal workflows; built KPI-driven dashboards used by alliance stakeholders during performance and strategic review cycles; and supported partner teams by enabling self-service analytics capabilities, increasing dashboard adoption while reducing dependency on manual reporting and ad-hoc data requests.
Associate Software Engineer
Jun 2021 - Jun 2022 • 1 yr
Built and maintained real-time Power BI monitoring dashboards leveraging Snowflake data to provide near-instant visibility into operational and performance metrics, significantly reducing anomaly detection time from approximately two hours to under fifteen minutes and enabling faster response and issue resolution by business teams; optimized backend-to-frontend data flows by improving data models, query logic, and refresh processes, which led to a 25% improvement in overall report accuracy and consistency across multiple dashboards; collaborated closely with finance and compliance teams to identify, investigate, and resolve critical data anomalies by aligning data definitions, validating source systems, and ensuring adherence to governance and regulatory requirements; and enhanced overall dashboard usability and adoption by implementing self-service features such as dynamic filters, drill-downs, and optimized visual performance, allowing stakeholders to explore data independently, gain deeper insights, and reduce reliance on manual reporting or ad-hoc analytical support.
