Kategorien durchsuchen
Entdecken
Fiverr Pro
Deutsch
$
USD

Observability Engineer Grafana, Alloy, Prometheus, Loki, Tempo, Otel, Kubernetes
Kompetenzen
Meine Dienstleistungen

Observability and Site Reliability Engineer
LogicEra • Freiberufler
May 2024 - Present • 2 yrs 3 mos
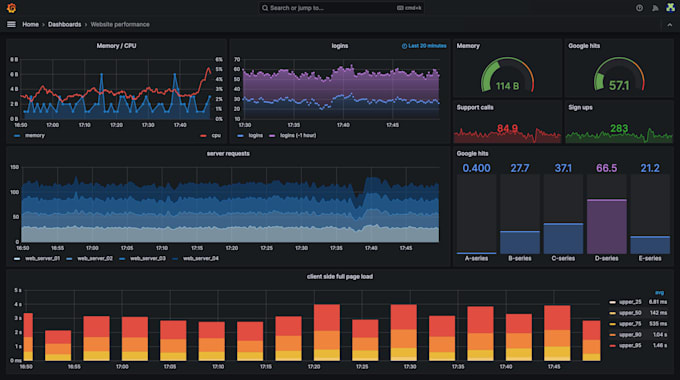
Observability Engineer and DevSecOps practitioner with hands-on production experience designing and operating full-stack observability platforms across Azure and AWS. Experienced in Kubernetes monitoring, metrics, centralized logging, distributed tracing, dashboards, alerting, and OpenTelemetry. Led the migration from Datadog SaaS to a self-hosted Grafana-based observability stack, delivering comparable observability capabilities while reducing annual costs by approximately $72,000. Skilled in Prometheus, Grafana, Loki, Tempo, Alloy, Alertmanager, ELK Stack, Kubernetes, CI/CD, and cloud platforms. Strong focus on reliability, cost optimization, automation, and practical production troubleshooting. KEY ACHIEVEMENT Observability Platform Migration and Cost Optimization - Approximately $72,000 Annual Savings Identified high recurring Datadog SaaS licensing costs and designed and deployed a production-grade, self-hosted Grafana observability platform on Kubernetes. Implemented metrics, centralized logging, distributed tracing, dashboards, alerting, and telemetry collection using Prometheus, Grafana, Loki, Tempo, Alloy, OpenTelemetry, and Alertmanager. Replaced the previous SaaS-based monitoring approach, improved data ownership and visibility, eliminated unpredictable licensing costs, and maintained reliable observability across production microservices.
