Kategorien durchsuchen
Entdecken
Fiverr Pro
Deutsch
$
USD

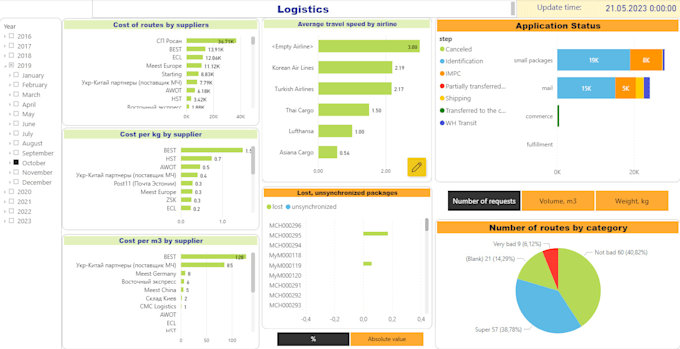

Visualization using Power BI involves leveraging the features and capabilities of the Power BI platform to create compelling and interactive visual representations of data. Power BI is a popular business intelligence tool that enables users to connect to various data sources, transform and model the data, and then design visually appealing dashboards and reports.
With Power BI, users can choose from a wide range of visualization types, including charts, graphs, maps, tables, and more. These visualizations can be customized and configured to suit specific data analysis requirements and to effectively convey insights. Power BI provides an intuitive drag-and-drop interface, allowing users to easily add data fields, apply filters, and arrange visual elements to create meaningful visualizations.
Power BI also supports interactive features such as drill-through, cross-filtering, and highlighting, enabling users to explore data in a dynamic manner. Users can interact with the visualizations, drill down into details, filter data based on specific criteria, and gain deeper insights.
Furthermore, Power BI offers advanced analytics capabilities, including the integration of machine learning m
Sprachen
