Kategorien durchsuchen
Entdecken
Fiverr Pro
Deutsch
$
USD


Struggling to make sense of your business data? I'll turn it into a clear, interactive Excel dashboard.
Whether you run an e-commerce store, retail business, or service company your data has answers. The problem is it's sitting in rows and columns nobody can read at a glance. I fix that.
What you get: Clean, interactive Excel dashboard with charts and KPIs Filters/slicers to explore your data by date, region, or category Business insights not just charts, but what your data is actually telling you Layout designed for decision-making, not decoration Fully editable update data anytime, charts refresh automatically
I've worked with: E-commerce data (revenue trends, top categories, delivery performance) Automotive market data (pricing analysis, brand performance) Business performance data (growth metrics, KPI tracking) Any CSV or Excel file you provide
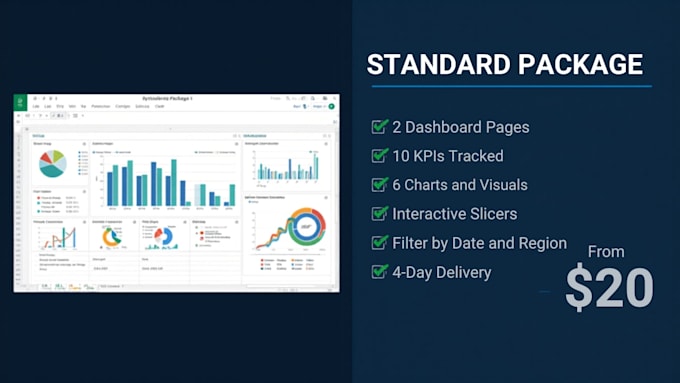
Packages: Basic 1 page, 5 KPIs, 3 charts (3-day delivery) Standard 2 pages, 10 KPIs, 6 charts, slicers (4-day delivery) Premium Full suite, unlimited KPIs, insight summary (6-day delivery)
Before ordering: Message me with your data type and key questions. I'll confirm I can deliver exactly what you need.
Let's make your data work for you
Data Analyst, Excel, Power BI, Python and SQL
Sprachen