Kategorien durchsuchen
Deutsch
$
USD
Verbinden Sie sich mit Ihrer KI


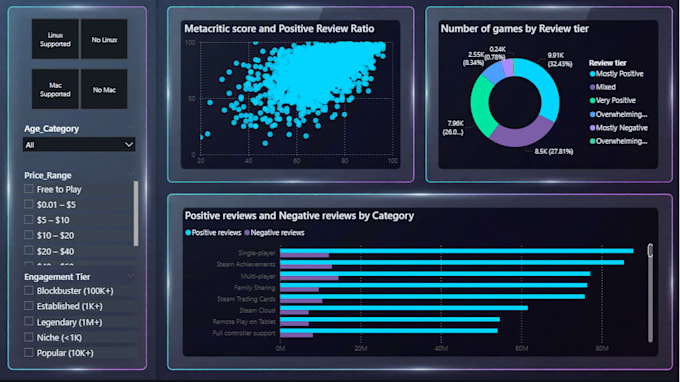
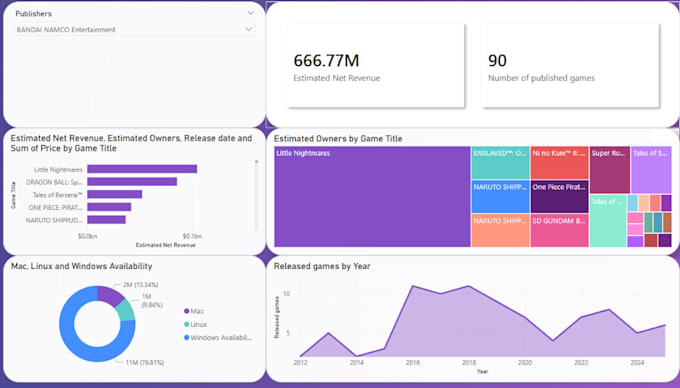
Stop making decisions based on guesswork.
Do you need a clear dashboard that shows your sales, profit, and business growth in one place without opening a messy spreadsheet or calculating numbers by hand?
I'm a data engineer, and I build you a fast, interactive Dashboard with a professional design suited for management presentations, with zero calculation errors.
What you'll get:
Why choose this service?
Data Scientist and Automation Expert
Sprachen
What file formats can I send you for my data?
Excel (.xlsx), CSV, or a shared link to a live data source (e.g., Google Sheets). If your data comes from a database or another tool, message me and I'll confirm compatibility before you order.
What if my file has more rows than my selected package allows?
I'll check your file as soon as it's uploaded and let you know immediately if it exceeds your package's limit. You can either upgrade to the next tier or I can advise on trimming the dataset — no work begins until this is resolved, so there's no risk of a mismatched delivery.
Can I update the data myself later?
Yes — the file is built to refresh with your new data in one click, no rebuilding needed.
What are the "custom metrics" (DAX) exactly?
Automated calculations like growth rate, profit margin, or year-over-year comparisons — built into the data model so they stay accurate as your data updates.
Can I request changes after delivery?
Yes, each package includes revisions for design and metric adjustments. A full change in data source or scope counts as a separate small addition.
Is my data kept confidential?
Yes. Your files are used only to build your dashboard and aren't shared or retained beyond your order.
Can I add my brand colors or logo?
Yes — share them with your order and I'll include them in the design.