Kategorien durchsuchen
Entdecken
Fiverr Pro
Deutsch
$
USD

Data Analyst
Kompetenzen
Meine Dienstleistungen
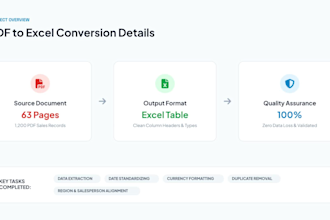
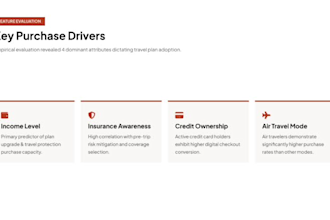

Data Analyst & Data Science Practitioner
Easy Skill Career Academy • Vollzeit
Apr 2023 - Sep 2026 • 3 yrs 5 mos
Worked on data analytics and data science projects involving data cleaning, data preprocessing, exploratory data analysis (EDA), and customer segmentation. Used Python, Pandas, NumPy, Matplotlib, and machine learning techniques to analyze datasets and identify meaningful patterns. Applied K-Means Clustering, an unsupervised machine learning algorithm, to segment customers based on relevant features and behavioral patterns. Evaluated customer groups, interpreted clustering results, and developed data-driven insights to support business decision-making and marketing strategies.

Excel, Data Analytics & Data Science Specialist
Uncodemy • Vollzeit
Mar 2021 - Mar 2023 • 2 yrs
Specialized in Microsoft Excel, data cleaning, data formatting, data validation, formulas, PivotTables, and reporting. Worked with data analytics and data science techniques to transform raw data into meaningful insights using Excel, SQL, Python, Power BI, and Tableau. Performed exploratory data analysis, identified trends and patterns, created visualizations and reports, and applied machine learning techniques such as K-Means Clustering for customer segmentation. Focused on data-driven insights to support business decisions, understand customer behavior, and improve business performance.
