Kategorien durchsuchen
Entdecken
Fiverr Pro
Deutsch
$
USD

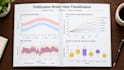
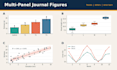
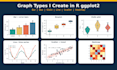


Have your data in Excel or CSV and need clear, journal-style graphs? I turn it into clean figures with R and ggplot2.
I am an MPhil scholar in Botany with hands-on research experience, so I know what a thesis, paper or poster figure needs: readable axes, correct units, tidy legends and consistent colours.
GRAPHS I MAKE:
- Bar charts with error bars
- Boxplots and violin plots
- Scatter plots with trend lines
- Line graphs and time series
- Histograms and density plots
- Heatmaps, faceted and grouped plots
YOU RECEIVE:
- High-resolution PNG and PDF files (other formats depending on the package)
- Sizing and fonts set to your journal or university guide
- The R script (Standard and Premium only)
- Revisions as listed in your package
TO START, SEND:
1. Your data file (Excel or CSV)
2. The graph type, or a sample figure you like
3. Your journal or thesis guidelines, if any
Your data is used only for your order. I speak English, Urdu and Pashto, so feel free to write in any of them.
Not sure which package fits? Send a message before ordering.
Researcher data analyst, Study Area Maps expert and R Programmer
Sprachen
What data do you need?
Your data in Excel or CSV, the graph type you want (or a sample image), and any journal or thesis figure rules.
Which file formats will I get?
PNG and PDF in the Basic package. Standard and Premium include the formats listed in the package details.
Do I get the R script?
Yes, in Standard and Premium. Basic includes the graph files only.
Can you follow my journal's figure rules?
Yes. Send the author guidelines and I will set the size, fonts and resolution to match them.
Is my data kept private?
Yes. I use your data only to make your graphs and do not share it.
Which languages can we use?
English, Urdu or Pashto, whichever you prefer.


