Kategorien durchsuchen
Entdecken
Fiverr Pro
Deutsch
$
USD


Automatische Übersetzung
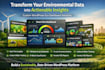
Möchtest du Umweltdaten in ein kraftvolles, interaktives digitales Ökosystem verwandeln?
Dieser WordPress Website-Design-Service wandelt komplexe Nachhaltigkeitsprozesse in klare, messbare und visuell intelligente Systeme um, die um Smart Hive Dashboard-Strukturen und Hive Analytics UX-Prinzipien aufgebaut sind.
Mit diesem WordPress Website-Design-Ansatz wird deine Plattform so gestaltet, dass sie Echtzeit-Umweltleistung zeigt, inklusive Pollination Heatmaps, Landwirtschafts-Dashboards und strukturierte Datenflüsse, die darstellen, wie Abfall zu Wert wird. Das System ist nicht nur für visuelle Darstellungen, sondern auch für Entscheidungsfindung, Investorenberichte und operative Intelligenz konzipiert.
Was du erwarten kannst:
Bevor du eine Bestellung aufgibst, ist es am besten, zuerst eine Nachricht zu schicken, damit deine Smart Hive Dashboard-Struktur, Ziele und Feature-Anforderungen richtig abgestimmt werden können.
Bitte informiere den Freelancer über alle Präferenzen oder Bedenken in Bezug auf den Einsatz von KI-Tools bei der Ausführung und/oder Lieferung deines Auftrags.
Bitte beachte, dass es gegen die Richtlinien von Fiverr verstößt, wenn Freelancer Themes, Vorlagen oder andere Elemente, die die Rechte Dritter oder geltende Gesetze verletzen, in die gelieferte Arbeit aufnehmen. Lies mehr darüber in unseren Leitfaden für verantwortungsvolle digitale Kreation.
WordPress Job Board and Talent Matching Expert
Sprachen
Automatische Übersetzung
Automatische Übersetzung
Was genau erhalte ich bei diesem WordPress-Design-Service?
Du erhältst ein vollständig strukturiertes Eco-Tech WordPress-System, das um Smart Hive Dashboard-Konzepte und Hive Analytics UX aufgebaut ist. Dazu gehören interaktive Dashboards, kreisförmige Analytik und saubere, datengetriebene Visuals, die zeigen, wie Abfall in messbaren Wert umgewandelt wird. Alles ist auf Klarheit und Leistung ausgelegt.
Kannst du komplexe Daten-Dashboards wie Carbon Tracking oder Water Recycling Graphs erstellen?
Ja, das System ist speziell für fortgeschrittenes Umwelt-Tracking wie Carbon Tracking, Water Recycle Graphs und Circular Analytics konzipiert. Du erhältst visuelle Dashboards, die Echtzeit-Nachhaltigkeitsleistung klar und verständlich präsentieren. Perfekt für Monitoring und Berichte.
Ist das geeignet für Multi-Farm oder große Umwelt-Netzwerke?
Absolut, die Smart Hive Dashboard-Struktur unterstützt Multi-Farm-Netzwerke und groß angelegte Umweltsysteme. Du kannst Operationen an verschiedenen Standorten verfolgen und gleichzeitig eine einheitliche Hive Analytics UX beibehalten. Das erleichtert die Verwaltung und Visualisierung verteilter Nachhaltigkeitsdaten.
Können Investoren oder Stakeholder die Plattform für Berichte nutzen?
Ja, das System beinhaltet Funktionen für das Investor ESG Portal, die Transparenz und Berichterstattung fördern. Stakeholder können Umweltimpact, Effizienzmetriken und Nachhaltigkeitsleistung einfach einsehen. Es verwandelt komplexe Daten in klare, entscheidungsbereite Visuals.
Fügst du KI-basierte Features wie Waste Classification ein?
Ja, AI Waste Classify Visuals können in das WordPress-Design integriert werden. Das automatisiert die Identifikation und Kategorisierung von Abfallströmen und verbindet sie mit Circular Economy Analytics. Das erhöht sowohl die Genauigkeit als auch die operative Effizienz.
Wie anpassbar ist das Design und die Markenrichtung?
Das Design folgt einem Eco-tech futuristischen Stil, ist aber vollständig anpassbar an deine Bedürfnisse. Du kannst das Gleichgewicht zwischen Green und Industrial UI, kreisförmige Flusssysteme und minimalistische Markenführung anpassen. Alles wird maßgeschneidert, damit dein Smart Hive Dashboard deine genaue Vision widerspiegelt.
Soll ich Sie kontaktieren, bevor Sie eine Bestellung aufgeben?
Ja, es ist sehr empfehlenswert, zuerst eine Nachricht zu schicken, damit deine Hive Analytics UX-Struktur richtig geplant wird. Das sorgt für Klarheit bei Umfang, Features wie Automation Workflow oder Impact Cert Pages und vermeidet Missverständnisse. Eine kurze Beratung hilft, deine Vision vor Beginn der Entwicklung abzustimmen.
