Kategorien durchsuchen
Entdecken
Fiverr Pro
Deutsch
$
USD

Hi there!
Are you in need of a skilled React developer with a specialization in data visualization to help you build and maintain your web applications? Look no further!
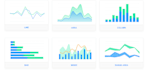
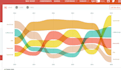
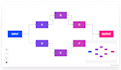
I am a highly experienced and proficient React developer, with a strong background in web development and a passion for building intuitive and user-friendly applications that effectively tell stories with data. I have extensive experience working with React and its ecosystem, including popular libraries such as Chart.js, Recharts, Victory, Visx, Nivo, and React Vis for data visualization.
In addition to my technical skills, I am a reliable and communicative team player, and I always strive to deliver top-quality work on time.
Whether you need help building a new application from scratch, maintaining an existing one, or simply adding data visualization capabilities to an existing application, I am here to help. I am confident that my skills and expertise can help you bring your project to the next level, and I am particularly interested in helping you tell compelling stories with data through effective visualization.
Let's work together and bring your vision to life!
Sprachen


