Diese Dienstleistung ist vorübergehend nicht verfügbar

I will visualize your data, make comprehensive charts using python

H
hazarzygc
H
hazarzygc
hazarzygc
Einige Informationen werden in englischer Sprache angezeigt.

Über diesen Service

I have been working with Python for about 4 years.


At the same time, I have been working on data science topics for 2 years.


I work as a data scientist at a company.


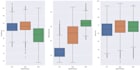
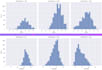
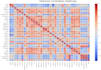
I have done a lot of data analysis in both my business and personal projects. I have constantly prepared data visualizations for these data analyses.


I can visualize your data using various libraries in the Python environment. I can deliver this visualization as code, report.


  • Bar Chart
  • Line Chart
  • Histogram
  • Pie Chart
  • Scatter Plot
  • Tree Chart
  • Scatter Plot
  • Area Chart
  • Heat Map
  • Bubble Chart


  1. Jupyter Notebook
  2. Python Script
  3. Spyder
  4. Report


Lerne hazarzygc kennen

hazarzygc
  • AusTürkei
  • Mitglied seitMärz 2022
  • Sprachen

    Türkisch, Englisch
I am a fourth-year Computer Engineering student, also working part-time as a data scientist at a company. I have been interested in data science, machine learning and artificial intelligence for about 3 years. I have completed a lot of projects in the fields of data analysis, image processing, machine learning: image classification, churn (customer loss) analysis, live covid-19 statistics, web scraping, etc.