Kategorien durchsuchen
Entdecken
Fiverr Pro
Deutsch
$
USD

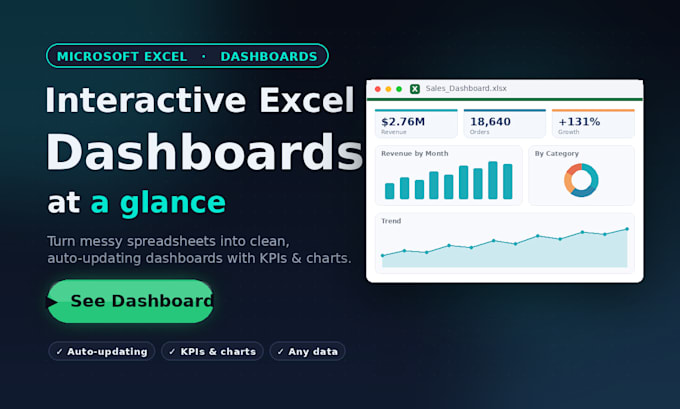
Still staring at static spreadsheets? I'll turn your data into a beautiful, interactive dashboard you can actually explore filter, hover, zoom, and drill into your numbers in real time.
Built in Python with Plotly and Streamlit, your dashboard is fast, modern, and fully yours no monthly subscriptions, no per-user fees.
What you'll get:
- Clean, interactive charts (bar, line, donut, scatter & more)
- Live KPI cards for your headline numbers
- Filters, dropdowns & date ranges to slice your data
- A dynamic Excel file that updates itself when you add data
- Source code + simple run instructions (and optional web hosting)
Unlike a one-off chart, this is a reusable tool. Add new data and the dashboard updates. Works with Excel, CSV, Google Sheets, or databases.
I bring real, hands-on data experience and care about clean, accurate, on-time work with revisions until it's exactly right.
Send me your data and what you want to track, and I'll show you how I can help.
Excel Expert in Dashboards VBA Automation Data Cleaning
Sprachen
What technology do you use?
Python with Plotly and Streamlit (or Dash), plus pandas for the data. Modern, open-source, and free of subscription fees.
Do I need to know how to code or install anything?
No. You get an interactive dashboard you open in any browser. If you want the runnable app, I include simple step-by-step instructions.
Can it update when my data changes?
Yes. The dashboard is interactive, and I also deliver a dynamic Excel file with live formulas that recalculates when you edit or add data.
What data sources can you use?
Excel, CSV, Google Sheets, or a database. Just send a sample.
Can you put it online?
Yes — it runs locally, or I can deploy it to Streamlit Cloud so you get a shareable link (extra).
Is my data confidential?
Always. Your files are private and never shared.