Kategorien durchsuchen
Deutsch
$
USD
Deine KI mit Fiverr verbinden
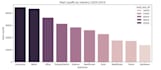
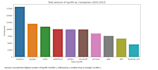
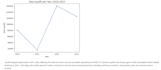

Struggling to make sense of your dataset? Don't worry, I'll transform it into clean, modern reports with super simple, easy-to-understand visuals.
What I offer:
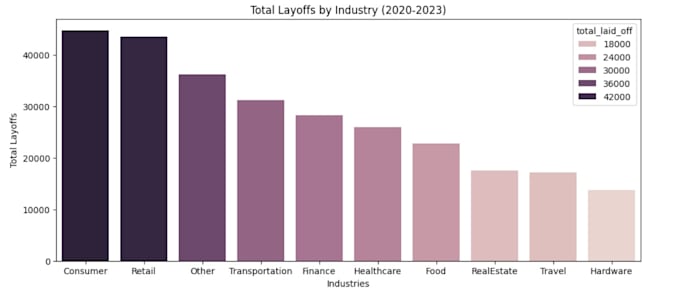
Why work with me: I don't just make charts I build data stories. Every project is structured to walk you through a clear narrative: what's happening in your data, why it matters, and what you can act on. Check out my portfolio project analyzing global layoffs trends to see this approach in action.
Tools Used - Python ( Pandas, Numpy, Matplotlib, Seaborn), Power BI, Excel
Whether you need a quick chart or a full multi-page dashboard, I'll deliver clean, professional, and easy-to-understand results on time, every time.
Message me and turn your data into a story worth telling
Data Analyst
Sprachen
Q: What do I need to get started?
Just send me your dataset (CSV or Excel) and let me know what questions or insights you're looking for.
Q: Do I need Power BI to view my dashboard?
No, I'll share it as a PDF, so no software needed on your end.
Q: Can you handle large datasets (like 50000+) ?
Yes, message me your dataset size first so I can confirm timing.